Transcriptomics: Understanding Gene Activity Through RNA
Introduction
Every cell in your body carries essentially the same DNA. Yet a neuron and a liver cell perform remarkably different functions. Much of this functional diversity comes from differences in gene expression, RNA processing, and protein regulation. Most cells share the same genomic blueprint, but they activate different genes and produce distinct RNA molecules according to their biological roles and environmental conditions. Transcriptomics, the genome-wide study of RNA molecules produced by cells, helps explain how this happens, providing a dynamic picture of gene expression and cellular activity (Conesa et al., 2016).
By examining RNA abundance and transcript diversity, researchers can determine which genes are active, how cells process their transcripts, and how cellular responses change during development, disease, and environmental stress. Over the past two decades, modern transcriptomics has transformed molecular biology by enabling researchers to examine thousands of RNA transcripts at the same time rather than studying individual genes in isolation. From conventional RNA sequencing (RNA-seq) to single-cell and spatial transcriptomics, these technologies offer increasingly detailed insights into cellular function.
But how do scientists measure gene activity through RNA? What can transcriptomic data reveal about human health, and what are the limitations of these technologies? And critically, when do technical constraints undermine the biological conclusions drawn from these methods?
This article explores how transcriptomics works, its major technologies, practical applications, and emerging developments, with careful attention to what the evidence actually supports.
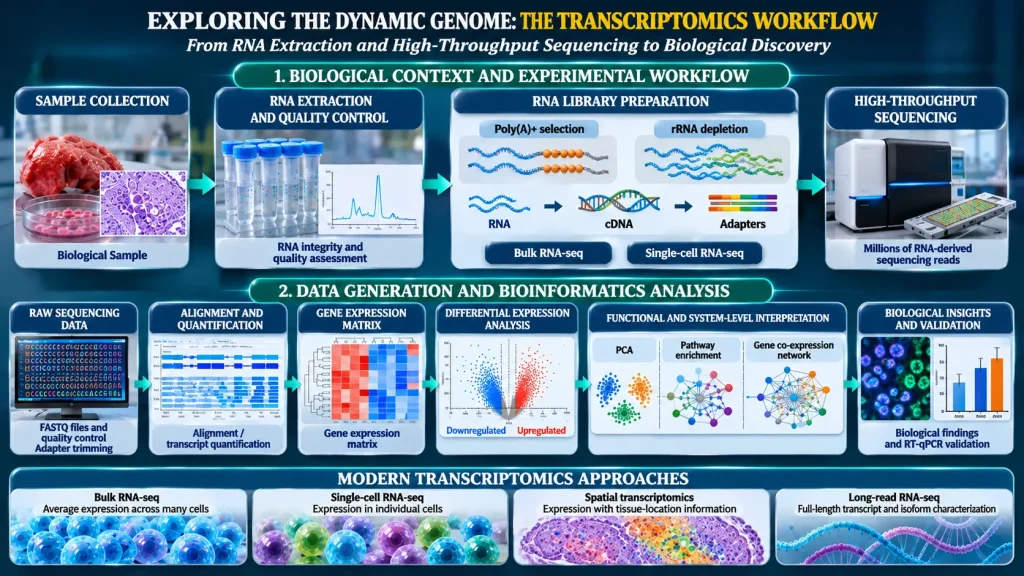
How does transcriptomics decode gene activity? The infographic below illustrates the key stages of the transcriptomics workflow, from RNA extraction and sequencing to bioinformatics analysis, revealing how researchers uncover gene expression patterns and biological insights.
What Is Transcriptomics?
To answer these questions, we first need a clear definition. Transcriptomics is the comprehensive analysis of RNA transcripts produced by a genome under specific biological conditions or within a particular cell type (Wang et al., 2009).
The term combines transcript, meaning an RNA molecule copied from a DNA sequence, with omics, indicating a genome-scale approach. Unlike genomics, which investigates the relatively stable DNA sequence, transcriptomics captures a dynamic picture of RNA production and processing.
It is important to distinguish between gene expression, transcription rate, and transcript abundance. These terms are related but not interchangeable. Most conventional RNA-seq experiments measure accumulated RNA rather than transcription rate directly. Nascent-RNA methods are more suitable for investigating newly synthesized RNA and transcriptional dynamics.
Note: Explore our Genomics & Sequencing section to discover the latest advances in genome analysis and sequencing technologies.
RNA Classes in the Transcriptome
The transcriptome includes several RNA classes:
- Messenger RNA (mRNA): Carries protein-coding information from DNA to ribosomes.
- Transfer RNA (tRNA): Delivers amino acids during protein synthesis.
- Ribosomal RNA (rRNA): Forms the structural and functional core of ribosomes.
- MicroRNA (miRNA): Participates in post-transcriptional gene regulation.
- Long non-coding RNA (lncRNA): Includes diverse regulatory RNA molecules.
- Small nuclear RNA (snRNA): Participates in RNA processing, particularly splicing.
- Small nucleolar RNA (snoRNA): Helps modify and process other RNA molecules.
- Circular RNA (circRNA): Forms covalently closed RNA molecules with diverse regulatory functions.
Not every transcriptomic experiment captures all these RNA classes. Detection depends on RNA extraction, enrichment, depletion, and library preparation strategies. As a result, transcriptomics provides an important molecular connection between the genome and the proteome, but one that requires careful interpretation.
How Does Transcriptomics Work? From Microarrays to RNA Sequencing
Now that we know what transcriptomics measures, the next question is how the technology evolved to measure it. Transcriptomics has changed considerably over the past few decades. Early approaches relied on hybridization technologies, while modern studies increasingly use high-throughput sequencing to investigate RNA molecules.
Early Approaches: Hybridization and Tag-Based Methods
Before high-throughput sequencing became widely available, researchers relied on DNA microarrays to measure gene expression. Microarrays use fluorescently labelled nucleic acids that hybridize with complementary DNA probes attached to a solid surface. The resulting fluorescence intensity provides an estimate of the abundance of known transcripts (Wang et al., 2009).
Although microarrays were important in early gene expression research, they had several limitations. They required prior knowledge of target sequences, could not reliably identify previously unknown transcripts, their dynamic range was more limited than modern sequencing approaches, and cross-hybridization could affect measurement accuracy. Serial analysis of gene expression (SAGE) used short sequence tags to estimate transcript abundance, but its short tags limited the identification of complete transcript structures and isoforms.
RNA Sequencing (RNA-seq): A Major Approach to Transcriptome Analysis
These limitations drove the development of a more powerful approach. RNA sequencing (RNA-seq) has become a major technology for investigating transcriptomes. In a typical RNA-seq experiment, researchers extract RNA from biological samples, assess its quality, convert selected RNA molecules into complementary DNA (cDNA), and prepare sequencing libraries. Millions of fragments are then sequenced in parallel using next-generation sequencing platforms (Hu et al., 2024).
Researchers then align the resulting sequencing reads to a reference genome or transcriptome. When no suitable reference is available, they assemble the reads de novo. Researchers then quantify transcript abundance and investigate expression differences, alternative splicing, and other RNA-related features.
Library Preparation Strategies
Before sequencing begins, however, an important experimental decision involves library preparation:
- Poly(A) selection: Enriches many mature messenger RNAs by capturing their polyadenylated tails.
- Ribosomal RNA depletion: Removes abundant ribosomal RNA, allowing a broader range of transcripts, including some non-polyadenylated RNAs, to be retained.
- Small-RNA library preparation: Uses specialized protocols to investigate molecules such as microRNAs and other short RNA species.
The choice of library preparation directly influences which RNA molecules can be detected and quantified (Conesa et al., 2016). Importantly, poly(A)+ selection introduces a systematic length-dependent bias. Libraries show reduced splice junction representation and pronounced 3′ end coverage bias for transcripts longer than approximately 5 kb, and the effect becomes more severe as transcript length increases. In contrast, ribosomal RNA depletion provides more uniform 5′ to 3′ coverage and stronger splice junction support, particularly for long disease-relevant transcripts such as TTN (>100 kb) and OBSCN (~39 kb). This difference is not merely technical. It determines whether researchers detect long, clinically relevant isoforms. RNA-seq generally offers a wider dynamic range than many microarray platforms and can identify previously unannotated transcripts and alternative splicing events. However, detection depends on library preparation, sequencing depth, read length, and analytical methods (Stark et al., 2019).
Short-Read Versus Long-Read RNA Sequencing
Once RNA is converted into a sequencing library, another key decision is read length. Most conventional RNA-seq experiments use short-read sequencing, typically generating reads of approximately 50 to 200 base pairs. Short-read sequencing is particularly effective for gene expression quantification and differential expression analysis. However, it can struggle to reconstruct complete transcript isoforms when multiple alternative splicing events occur within the same gene.
To address this limitation, long-read sequencing technologies developed by Oxford Nanopore Technologies (ONT) and Pacific Biosciences (PacBio) can sequence complete or near-full-length RNA-derived molecules, improving transcript isoform characterization (Monzó et al., 2025). Their major advantages include improved identification of full-length transcript isoforms, better characterization of complex alternative splicing patterns, detection of previously uncharacterized transcript variants, and greater ability to investigate transcript structure.
Platform-Dependent Biases in Long-Read Sequencing
However, a critical caveat is often underemphasized. Long-read platforms exhibit systematic, platform-dependent biases that affect transcript quantification. The LongBench benchmark, which systematically evaluated ONT PCR-cDNA, ONT direct RNA, and PacBio Kinnex alongside Illumina short reads, found high concordance in gene-level differential analyses across protocols, but reduced consistency for transcript-level and isoform analyses due to length- and platform-dependent biases. Furthermore, a 2026 systematic evaluation of normalization strategies demonstrated that standard Transcripts Per Million (TPM) scaling counteracts short-molecule depletion in PacBio datasets but severely distorts Nanopore expression estimates. For Nanopore libraries, covariate-aware normalizations (CQN and EDASeq) mitigate length bias without TPM’s over-correction penalty. These are not minor technical footnotes. They determine whether transcript-level conclusions from long-read data are reliable.
Certain direct-RNA sequencing methods can also detect RNA modifications through platform-specific signals. However, this capability depends on the sequencing technology, experimental protocol, and analytical approach. Long-read sequencing therefore complements short-read RNA-seq, particularly when transcript structure and isoform diversity are important research questions (Monzó et al., 2025), but only when platform-specific biases are explicitly addressed in the analysis.
Comparison of Major Transcriptomics Technologies
Taken together, these technologies form a spectrum from targeted to comprehensive, and from short to long reads. The table below summarizes their trade-offs.
| Technology | Principle | Key strength | Key limitation |
| Microarrays | Hybridization to predefined probes | Established and relatively straightforward | Requires known sequences; limited dynamic range |
| Short-read RNA-seq | Sequencing of cDNA fragments | High-throughput expression quantification | Limited full-length isoform resolution; poly(A)+ selection biases against long transcripts |
| Long-read RNA-seq | Sequencing of long RNA-derived molecules | Better characterization of complete transcript isoforms | Platform-dependent length biases; cost and analytical complexity |
| Single-cell RNA-seq | Profiling individual cells | Reveals cellular heterogeneity | Dropout, dissociation bias, and limited capture sensitivity |
| Spatial transcriptomics | RNA measurement with tissue-location information | Preserves spatial gene expression patterns | Variable resolution, coverage; lacks unified standardization |
A Practical RNA-seq Workflow: From Samples to Gene Expression Results
Understanding these technologies is useful, but it also helps to see how they are applied in practice. The experimental steps between sample collection and biological interpretation are essential for evaluating transcriptomic research. A typical RNA-seq workflow involves six major stages (Conesa et al., 2016; Hu et al., 2024).
Stage 1: Define the Research Question and Experimental Design
The workflow begins with careful planning. Researchers first select the biological samples, experimental groups, and research objectives. They determine whether bulk RNA-seq, single-cell sequencing, or another approach is most suitable. Adequate biological replication, appropriate controls, randomization, and sample-size planning are essential for reducing bias and improving statistical reliability. Critically, when planning single-cell experiments, researchers must decide at the design stage whether individual cells will be treated as independent replicates. This decision has profound implications for downstream inference (see Limitations section).
Stage 2: Extract and Assess RNA
Once the design is set, the next step is sample preparation. RNA is isolated from the selected biological material and evaluated for quality and integrity. Degraded RNA can compromise transcript detection and full-length isoform analysis, particularly in long-read sequencing applications (Monzó et al., 2025).
Stage 3: Prepare the Sequencing Library
With quality RNA in hand, researchers select an appropriate library preparation strategy, such as poly(A) selection or ribosomal RNA depletion, depending on the RNA molecules being investigated. As noted above, this choice has systematic consequences for which transcripts are detectable, particularly for long or alternatively spliced genes.
Stage 4: Sequence and Assess Reads
The prepared library then undergoes sequencing. Researchers evaluate read quality, sequencing depth, and potential contamination before proceeding with downstream analysis.
Stage 5: Quantify and Analyse Gene Expression
After sequencing, the focus shifts to computation. Sequencing reads are processed using appropriate bioinformatics pipelines. Expression estimates are generated, normalized, and statistically analysed to identify differentially expressed genes.
Stage 6: Interpret and Validate Findings
Finally, the results require biological context. Researchers investigate the biological significance of the results and validate selected findings using independent approaches, such as quantitative PCR (qPCR).
Important Bioinformatics Tools Used in RNA-seq Analysis
To carry out these computational steps, researchers rely on a standard set of tools.
| Tool | Main application |
| FastQC | Sequencing quality assessment |
| STAR | Alignment of sequencing reads |
| Salmon | Transcript abundance quantification |
| DESeq2 | Differential gene expression analysis |
| clusterProfiler | Functional enrichment analysis |
| Seurat | Single-cell RNA-seq analysis |
The selection of tools depends on the research question, sequencing platform, experimental design, and analytical requirements. No single pipeline is suitable for every transcriptomic experiment.
Differential Gene Expression: How Do Scientists Identify Active Genes?
Among the many outputs of this workflow, one of the most important applications of transcriptomics is differential gene expression analysis. Sequencing generates read counts for individual genes, but raw counts cannot be compared directly across samples without accounting for sequencing depth and other sources of variation. Researchers therefore apply quality control, appropriate normalization, and statistical testing to identify differentially expressed genes (Conesa et al., 2016).
Key Statistical Concepts
To interpret differential expression results correctly, three important concepts help.
- Fold change: Describes the magnitude of an expression difference between experimental groups. For example, a fourfold increase indicates that the measured expression is four times higher in one group than the reference group.
- P-value: Indicates the statistical evidence against the null hypothesis of no difference. A small p-value suggests that the observed difference would be unlikely under the specified null model.
- False discovery rate (FDR): Addresses the problem of multiple hypothesis testing. Because RNA-seq experiments may examine thousands of genes simultaneously, some apparently significant findings can occur by chance. The Benjamini-Hochberg procedure is commonly used to control the false discovery rate (Benjamini & Hochberg, 1995).
RPKM and TPM provide relative expression estimates, but their values depend on the composition of the RNA population. They should not automatically be treated as directly comparable across samples or sequencing protocols (Zhao et al., 2020). For differential expression analysis, researchers commonly use count-based statistical frameworks such as DESeq2, with normalization methods appropriate to the experimental design (Love et al., 2014).
Importantly, statistical significance does not necessarily indicate biological importance. A gene may show a statistically significant expression difference but have a relatively small effect size. Researchers must also consider biological variation, confounding factors, and independent validation.
A Critical Distinction: Biological Replicates vs. Technical Replicates
Beyond these statistical concepts, the structure of the data itself matters. In bulk RNA-seq, biological replicates (for example, different animals or patients) are essential for estimating biological variance. In single-cell RNA-seq, the situation is more complex and frequently misunderstood. Treating individual cells from the same library as independent biological replicates constitutes pseudoreplication, a statistical error that inflates false discovery rates.
A 2026 data commentary documented this problem specifically in sleep-deprivation single-cell datasets, noting that many such datasets contain zero biological replicates at the condition-within-region level, with conditions represented by single pooled libraries. The commentary’s inventory was targeted to sleep research, and its findings should not be assumed to apply uniformly across all single-cell domains. The recommended solution is pseudobulk analysis: summing counts across cells within each biological sample (library or donor) to generate sample level expression estimates before differential testing. Researchers and reviewers should verify that single-cell differential expression analyses account for the hierarchical structure of the data rather than treating thousands of cells as independent observations.
Practical Example: Comparing Healthy and Diseased Tissues
To see how these concepts work together, consider an RNA-seq experiment comparing healthy breast tissue with breast cancer samples. Suppose a particular gene shows a fourfold increase in expression in tumour samples, with an adjusted p-value of 0.01.
This result suggests that the gene is significantly upregulated in the cancer group after correction for multiple testing. However, increased expression alone does not establish that the gene causes cancer. Researchers must investigate its biological function, examine relevant molecular pathways, and validate the finding using independent samples and complementary experimental approaches.
How Are Differentially Expressed Genes Visualized?
Once differential expression has been calculated, visualization helps researchers interpret the results. Two commonly used plots serve this purpose.
Volcano Plots
Volcano plots display the relationship between the magnitude of gene expression changes and their statistical significance. The horizontal axis represents log2 fold change, while the vertical axis represents the negative logarithm of the adjusted p-value. Genes towards the right may represent upregulated genes, and genes towards the left may represent downregulated genes. Genes higher on the plot generally show stronger statistical evidence.
Gene Expression Heatmaps
While volcano plots show single genes, heatmaps reveal broader patterns. Gene expression heatmaps display expression patterns across multiple genes and biological samples. Typically, rows represent genes and columns represent samples. Colours represent relative expression levels, often after suitable transformation and scaling. Heatmaps help researchers identify patterns of gene expression, groups of similarly behaving genes, and differences between experimental conditions.
Major Applications of Transcriptomics
These analytical approaches underpin a wide range of applications. Transcriptomics now contributes to disease research, single-cell biology, plant science, artificial intelligence, and spatial mapping.
Disease Research and Biomarker Discovery
One of the most established applications is in medicine. Transcriptomics allows researchers to compare gene expression profiles between healthy and diseased tissues. In cancer research, RNA-seq can reveal tumour-associated expression signatures, altered signalling pathways, and molecular differences between tumour subtypes. These findings may help identify candidate diagnostic biomarkers, prognostic indicators, and potential therapeutic targets.
However, researchers must distinguish between experimental biomarker discovery and clinically validated diagnostic applications. Most newly identified transcriptomic biomarkers require extensive validation before clinical use. Some targeted RNA-expression-based tests are already used in particular clinical settings, but these should not be confused with routine whole-transcriptome RNA-seq.
Single-Cell and Single-Nucleus Transcriptomics
While bulk methods average across many cells, single-cell approaches resolve individual ones. Bulk RNA-seq measures average gene expression across a mixture of cells. Consequently, it can obscure differences between individual cell populations. Single-cell RNA sequencing (scRNA-seq) addresses this limitation by profiling RNA molecules from individual cells. It helps researchers investigate previously unrecognized cell populations, cellular heterogeneity within tissues, developmental and differentiation states, disease-associated cell populations, and changes in cellular gene expression.
Key Limitations of Single-Cell RNA-seq
However, single-cell RNA-seq has substantial limitations that researchers often understate in introductory treatments. Dropout events occur when transcripts present in a cell escape detection during library preparation. These events create sparse data matrices with many zero values, making statistical analyses more challenging. Detection sensitivity also remains limited because all scRNA-seq protocols capture only a fraction of the mRNAs in each cell. Therefore, researchers should not assume that undetected genes are unexpressed.
Cell dissociation bias presents another major concern. Researchers often use enzymatic and mechanical tissue processing to prepare single-cell suspensions. These procedures can damage fragile cells, such as neurons, or selectively recover certain cell populations. Moreover, tissue processing can trigger stress-related gene expression, thereby altering the transcriptional profiles that researchers aim to measure.
Single-Nucleus RNA-seq as an Alternative
To work around some of these problems, single-nucleus RNA-seq (snRNA-seq) provides an alternative by profiling isolated nuclei rather than intact cells. It can be particularly useful for frozen or difficult-to-dissociate tissues. Comparative single-nucleus transcriptomics has contributed to investigations of cellular diversity and evolutionary differences in the human cerebral cortex (Jorstad et al., 2023). However, snRNA-seq also has protocol-dependent biases, and neither approach should be assumed to provide an unbiased census of cell types in a tissue.
Understanding Single-Cell Data Through UMAP
Because single-cell datasets are often extensive, effective visualization is therefore essential. These datasets can contain thousands of cells and thousands of measured genes; consequently, visualizing such high-dimensional information requires specialized computational approaches. Uniform Manifold Approximation and Projection (UMAP) is a dimensionality-reduction method frequently used to visualize single-cell gene expression profiles.
In a typical UMAP plot, each point represents an individual cell. Cells with similar transcriptomic profiles tend to appear closer together, and clusters may represent distinct cell populations or cellular states. Furthermore, these clusters can be investigated using marker-gene expression. However, UMAP distances should not be interpreted as direct measures of biological distance, and clusters do not automatically represent distinct cell types. Therefore, researchers must consider marker genes, experimental evidence, and appropriate statistical methods when interpreting the results.
Plant Science and Agriculture
Beyond medicine, transcriptomics also contributes to crop improvement and agricultural biotechnology. Researchers use RNA-seq to compare plant responses under different environmental conditions, identifying genes and pathways associated with drought tolerance, cold resistance, pathogen defence, and other stress responses. For example, transcriptome data mining combined with co-expression network analysis has identified functional modules and regulatory genes in barley responding to cold stress, including transcription factors and kinases involved in stress signalling (Panahi & Shahi, 2024).
These findings can provide candidate genes for future crop improvement and breeding programmes. However, candidate genes identified through transcriptomic analysis require further functional and field validation before practical agricultural application.
Artificial Intelligence and Machine Learning in Transcriptomics
As transcriptomic datasets continue to grow in size and complexity, computational approaches are becoming increasingly important for their effective analysis. In this context, artificial intelligence (AI) and machine learning are playing an expanding role in bioinformatics by enabling researchers to extract meaningful biological information from large-scale datasets. More specifically, these approaches support a range of analytical tasks, including cell-type annotation, dimensionality reduction, noise reduction and data representation, batch-effect correction, and the integration of datasets generated using different experimental platforms. Furthermore, they facilitate the modelling of gene regulatory relationships, thereby providing additional opportunities to investigate complex patterns of gene expression and underlying biological processes.
More recently, deep learning methods, including graph neural networks and transformer-based architectures, have been explored for modelling relationships between genes, cells, and spatial expression patterns (Li et al., 2026). Transcriptomic foundation models are another emerging research direction.
What Independent Benchmarks Actually Show
However, enthusiasm for these models should be tempered by independent evidence. Independent benchmarks paint a more nuanced picture than enthusiastic reviews suggest. A systematic benchmark of thirteen single-cell foundation models across more than fifty datasets found that while pretrained embeddings capture biologically meaningful structure and provide clear advantages in low-label and transfer-learning scenarios, classical PCA approaches remain competitive or even preferable in other settings.
A separate 2026 benchmark of scGPT pipelines for cell-type annotation found that matched expression achieved higher pooled Macro F1 than scGPT in six of nine comparisons, with scGPT superior only in three brain comparisons. Under strict label scarcity, matched expression reached Macro F1 of 0.818 to 0.930 versus 0.779 to 0.881 for scGPT. A further zero-shot evaluation of four foundation models (scGPT, SCimilarity, UCE, and Transcriptformer) concluded that foundation model embeddings “did not consistently outperform traditional approaches” and that “their effectiveness remains dependent on the application and evaluation setting.”
These findings do not dismiss foundation models. They show genuine advantages in specific regimes, but they caution against assuming that newer, more complex models are universally superior. Computational predictions are not equivalent to experimentally confirmed biological mechanisms, and independent validation across diverse datasets and biological conditions remains essential.
Spatial Transcriptomics: Mapping Gene Expression Within Tissues
Finally, spatial methods add another important dimension by providing location-specific information. Traditional bulk RNA-seq combines RNA from many cells, thereby making it difficult to determine where particular transcripts originate within a tissue. To overcome this limitation, spatial transcriptomics measures gene expression while preserving information about the location of RNA molecules within tissue sections.
Depending on the technology used, measurements may represent spots containing multiple cells or approach cellular and subcellular resolution. Moreover, different spatial transcriptomics platforms employ distinct strategies. Some use predefined probe panels to detect selected transcripts, whereas others provide broader transcriptome-wide measurements. Consequently, researchers can use spatial transcriptomics to investigate tumour microenvironments, tissue development and organization, inflammatory responses, cellular interactions within tissues, and regional differences in gene expression.
Combining spatial transcriptomics with single-cell RNA-seq can provide complementary information about cellular identities and their tissue locations. However, spatial transcriptomics platforms differ in transcript coverage, detection sensitivity, spatial resolution, and cost. A 2025 review concluded that the field lacks unified standardization for reliability, reproducibility, and scalability, barriers that must be addressed before routine clinical translation. Systematic cross-platform benchmarks using adjacent tissue sections remain limited, though emerging efforts are beginning to address this gap. Researchers must select technologies according to their biological questions and validate important findings independently (Ståhl et al., 2016; Li et al., 2026).
RNA Editing: Another Layer of Transcriptome Diversity
Beyond expression levels and location, RNA molecules can also undergo chemical modifications. Gene expression depends not only on the amount of RNA cells produce but also on modifications that occur after transcription. For example, RNA editing alters the nucleotide sequence of an RNA molecule after cells transcribe it from DNA.
Among these modifications, a well-studied form is adenosine-to-inosine (A-to-I) RNA editing, catalysed by adenosine deaminase acting on RNA (ADAR) enzymes. During this process, ADAR enzymes convert adenosine residues in RNA into inosine.. Importantly, because cellular translation and RNA-processing machinery often interpret inosine similarly to guanosine, RNA editing can influence RNA sequence interpretation and molecular function. Furthermore, RNA editing can affect protein-coding sequences, RNA stability and processing, microRNA interactions, gene regulation, and nervous system function.
At the molecular level, transcriptomic sequencing approaches can help investigate RNA editing by identifying RNA sequence differences relative to the corresponding genomic DNA. However, reliable identification requires careful analysis to distinguish genuine editing events from DNA variants, sequencing errors, and mapping artefacts. Thus, RNA editing represents another important dimension of transcriptome diversity beyond conventional gene expression measurement (Nishikura, 2016).
Comparison of Major Transcriptomics Approaches
Having surveyed the major technologies and applications, it helps to compare them side by side. The table below summarizes the approaches discussed throughout this article.
| Approach | What is analysed? | Main purpose | Major advantage |
| Bulk RNA-seq | RNA from mixed cell populations | Average gene expression | Population-level expression analysis |
| Single-cell RNA-seq | RNA from individual cells | Cellular heterogeneity | Identifies distinct cell populations |
| Single-nucleus RNA-seq | RNA from isolated nuclei | Nuclear transcript profiles | Useful for frozen and difficult-to-dissociate tissues |
| Spatial transcriptomics | RNA with preserved tissue coordinates | Spatial gene expression | Retains tissue architecture and molecular location |
How Do You Choose the Right Transcriptomics Approach?
With so many options available, the most appropriate technology depends on the research question, sample type, budget, and required level of molecular resolution.
| Research question | Suitable starting approach |
| Which genes differ between two experimental conditions? | Short-read bulk RNA-seq |
| Which cell populations differ within a complex tissue? | Single-cell or single-nucleus RNA-seq |
| Which full-length transcript isoforms are present? | Long-read RNA-seq (with platform-appropriate normalization) |
| Where are transcripts located within tissue? | Spatial transcriptomics |
| Are selected genes expressed at different levels? | RT-qPCR or another targeted method |
These are general starting points rather than absolute rules. Experimental design and the biological objectives ultimately determine the most appropriate approach.
What Are the Limitations of Transcriptomics?
No technology is without constraints, and transcriptomics is no exception. Despite its considerable potential, it has several scientific and technical limitations that must be explicitly acknowledged.
RNA Abundance Does Not Always Reflect Protein Abundance
First, transcriptomics measures RNA molecules, not proteins. Post-transcriptional regulation, translation efficiency, and protein degradation influence the final protein abundance. Therefore, RNA expression data alone cannot fully explain cellular behaviour.
Library Preparation Introduces Technical Bias
Second, different library preparation methods capture different RNA populations. Poly(A) selection introduces length-dependent coverage bias that becomes pronounced for transcripts exceeding approximately 5 kb, with reduced splice junction support and 3′ end overrepresentation. Ribosomal RNA depletion can retain a broader range of transcripts but may also capture pre-mRNA, increasing intronic reads. RNA extraction, amplification, transcript length, and sequencing depth can also affect transcript representation.
RNA Degradation Affects Data Quality
Third, RNA is inherently unstable and susceptible to degradation. Poor sample handling can compromise sequencing results, particularly when investigating full-length transcript isoforms.
Short-Read Sequencing Has Limitations in Transcript Reconstruction
Fourth, short reads can be difficult to assign uniquely to repetitive genomic regions and complex transcript isoforms. Long-read technologies can improve transcript characterization but introduce their own platform-specific biases, including length-dependent quantification distortions that require platform-appropriate normalization strategies.
Single-Cell Analysis Introduces Distinct Analytical Challenges
Fifth, dropout events, dissociation bias, limited mRNA capture sensitivity, and technical noise can affect single-cell expression profiles. Pseudoreplication, which means treating individual cells as independent biological replicates, inflates false discoveries and remains a documented problem in specific domains, including sleep-deprivation transcriptomics. Pseudobulk methods are recommended when comparing conditions across biological samples. Integration of datasets from different laboratories and experimental platforms also remains a methodological challenge.
Spatial Transcriptomics Lacks Unified Standardization
Sixth, platform-dependent variation in resolution, sensitivity, and transcript coverage complicates cross-study comparisons. Systematic benchmarking efforts using adjacent tissue sections are still emerging.
Bioinformatics Analysis Can Influence Interpretation
Finally, RNA-seq datasets require appropriate quality control, alignment or quantification, normalization, statistical testing, and biological interpretation. Different analytical pipelines and statistical models can influence the results. Batch effects and sample heterogeneity may also confound comparisons across experiments (Conesa et al., 2016).
Consequently, researchers should interpret transcriptomic findings alongside experimental design, complementary molecular techniques, and independent biological evidence.
FAQs About Transcriptomics
What Is Transcriptomics in Simple Terms?
Transcriptomics is the study of all RNA molecules produced by cells. Furthermore, it helps researchers understand which genes are expressed and how gene activity changes under different biological conditions.
What Is the Difference Between Genomics and Transcriptomics?
Genomics studies the DNA sequence of an organism, whereas transcriptomics investigates the RNA molecules produced from that DNA. In contrast, genomic information is relatively stable, while transcriptomic profiles change according to cell type, developmental stage, and environmental conditions.
Can Transcriptomics Identify Gene Mutations?
Not directly in the same way as genomic sequencing. Transcriptomics measures RNA abundance and sequence, and some DNA variants may be reflected in RNA. However, detecting and confirming DNA-level mutations generally requires genomic sequencing or targeted genotyping.
Is RNA-seq the Same as Transcriptomics?
No. Transcriptomics is the broader scientific discipline concerned with studying RNA molecules. RNA-seq is one of its major technologies. Other approaches include microarrays and targeted RNA quantification methods.
Can Transcriptomics Be Used in Clinical Diagnosis?
Yes, in selected clinical contexts. Certain targeted RNA-expression tests are used in clinical practice, including some cancer-related expression panels. However, most transcriptomic biomarkers remain under research or validation and are not automatically suitable for routine diagnosis.
Conclusion: Why Is Transcriptomics Important?
In summary, transcriptomics has fundamentally changed how scientists investigate gene expression and cellular function. By examining RNA rather than DNA alone, researchers can explore the dynamic molecular programmes that define cellular identity, development, and disease.
From early microarrays to modern RNA sequencing, single-cell profiling, long-read sequencing, and spatial transcriptomics, technological advances have expanded our ability to investigate gene activity at increasingly detailed levels. Yet each advance brings its own technical constraints. Poly(A)+ selection biases against long transcripts, long-read platforms exhibit systematic quantification biases, single-cell methods suffer from dropout and dissociation effects, spatial platforms lack standardization, and foundation models show task-dependent rather than universal advantages over classical methods.
Ultimately, transcriptomics is not a complete explanation of biological function. RNA abundance does not always predict protein abundance, and experimental and computational limitations must be considered when interpreting results. Its greatest scientific value emerges when transcriptomic findings are integrated with genomics, proteomics, functional experiments, and other molecular approaches, and when researchers critically evaluate the technical boundaries of the methods they employ.
For students and researchers entering molecular biology, genetics, biotechnology, and bioinformatics, transcriptomics offers a powerful way to understand how the genome is expressed and regulated in living cells, provided that the tools are used with appropriate caution and the findings are interpreted within the constraints of the technology.
References
Foundational Methods and Best Practices
- Conesa, A., Madrigal, P., Tarazona, S., Gomez-Cabrero, D., Cervera, A., McPherson, A., Szcześniak, M. W., Gaffney, D. J., Elo, L. L., Zhang, X., & Mortazavi, A. (2016). A survey of best practices for RNA-seq data analysis. Genome Biology, 17, 13. https://doi.org/10.1186/s13059-016-0881-8 (Open Access)
- Hu, R., Islam, M. N., Varghese, R. S., & Ressom, H. W. (2024). Short-read RNA-seq. In Methods in Molecular Biology (Vol. 2822, pp. 245–262). Humana. https://doi.org/10.1007/978-1-0716-3918-4_17 (Institutional access may be required)
- Stark, R., Grzelak, M., & Hadfield, J. (2019). RNA sequencing: The teenage years. Nature Reviews Genetics, 20(11), 631–656. https://doi.org/10.1038/s41576-019-0150-2 (Institutional access may be required)
- Wang, Z., Gerstein, M., & Snyder, M. (2009). RNA-Seq: A revolutionary tool for transcriptomics. Nature Reviews Genetics, 10(1), 57–63. https://doi.org/10.1038/nrg2484 (Institutional access may be required)
Library Preparation and Transcript Coverage
- Natraj Gayathri, S., Lillback, V., Udd, B., Hackman, P., Savarese, M., & Oghabian, A. (2026). Poly(A)+ selection limits detection of long and alternatively spliced transcripts compared with rRNA depletion in RNA-Sequencing. BMC genomics, 27(1), 591. https://doi.org/10.1186/s12864-026-12944-z (Open Access)
- Gayathri, S. N., Lillback, V., Udd, B., Hackman, P., Savarese, M., & Oghabian, A. (2026). 1.50P Improved detection of long neuromuscular disease transcripts with ribosomal RNA depletion RNA-Seq. Neuromuscular Disorders, 67, 106605. https://doi.org/10.1016/j.nmd.2026.106605 (Institutional access may be required)
Statistical Analysis and Normalization
- Benjamini, Y., & Hochberg, Y. (1995). Controlling the false discovery rate: A practical and powerful approach to multiple testing. Journal of the Royal Statistical Society: Series B (Methodological), 57(1), 289–300. https://doi.org/10.1111/j.2517-6161.1995.tb02031.x (Institutional access may be required)
- Love, M. I., Huber, W., & Anders, S. (2014). Moderated estimation of fold change and dispersion for RNA-seq data with DESeq2. Genome Biology, 15(12), 550. https://doi.org/10.1186/s13059-014-0550-8 (Open Access)
- Zhao, S., Ye, Z., & Stanton, R. (2020). Misuse of RPKM or TPM normalization when comparing across samples and sequencing protocols. RNA, 26(8), 903–909. https://doi.org/10.1261/rna.074922.120 (Open Access)
Long-Read Sequencing
- Monzó, C., Liu, T. & Conesa, A. Transcriptomics in the era of long-read sequencing. Nat Rev Genet 26, 681–701 (2025). https://doi.org/10.1038/s41576-025-00828-z (Institutional access may be required)
- You, Y., Solano, A. N., Lancaster, J., David, M., Wang, C., Tan, J. W., Su, S., Pasquali, C., Zeglinski, K., Ghamsari, R., Chauhan, M., Gleeson, J., Prawer, Y. D. J., Ng, J., Dubois, B., Cleynen, I., Asselin-Labat, M.-L., Davidson, N. M., Sutherland, K. D., … Ritchie, M. E. (2025). Benchmarking long-read RNA-sequencing technologies with LongBench: a cross-platform reference dataset profiling cancer cell lines with bulk and single-cell approaches. openRxiv. https://doi.org/10.1101/2025.09.11.675724
- Paniagua, A., Jetzinger, F., Tarazona, S., & Conesa, A. (2026). Systematic evaluation of transcript normalization methods and quantification pipelines across long-read sequencing platforms. openRxiv. https://doi.org/10.64898/2026.10.10.757893
Single-Cell and Single-Nucleus Transcriptomics
- Jorstad, N. L., Song, J. H. T., Exposito-Alonso, D., Suresh, H., Castro-Pacheco, N., Krienen, F. M., Yanny, A. M., Close, J., Gelfand, E., Long, B., Seeman, S. C., Travaglini, K. J., Basu, S., Beaudin, M., Bertagnolli, D., Crow, M., Ding, S.-L., Eggermont, J., Glandon, A., … Bakken, T. E. (2023). Comparative transcriptomics reveals human-specific cortical features. Science, 382(6667). https://doi.org/10.1126/science.ade9516 (Institutional access may be required)
- Yang, Y. (2026). Unreplicated by design: Pseudoreplication, data leakage and the limits of inference in single-cell transcriptomics of sleep deprivation — a data commentary. Neurobiology of Sleep and Circadian Rhythms, 21, 100152. https://doi.org/10.1016/j.nbscr.2026.100152 (Institutional access may be required)
Spatial Transcriptomics
- Ståhl, P. L., Salmén, F., Vickovic, S., Lundmark, A., Fernández Navarro, J., Magnusson, J., Giacomello, S., Asp, M., Westholm, J. O., Huss, M., Mollbrink, A., Linnarsson, S., Codeluppi, S., Borg, Å., Pontén, F., Costea, P. I., Sahlén, P., Mulder, J., Bergmann, O., … Frisén, J. (2016). Visualization and analysis of gene expression in tissue sections by spatial transcriptomics. Science, 353(6294), 78–82. https://doi.org/10.1126/science.aaf2403 (Institutional access may be required)
- Ren, P., Zhang, R., Wang, Y. et al. Systematic benchmarking of high-throughput subcellular spatial transcriptomics platforms across human tumors. Nat Commun 16, 9232 (2025). https://doi.org/10.1038/s41467-025-64292-3 (Open Access)
RNA Editing
- Nishikura, K. (2016). A-to-I editing of coding and non-coding RNA by ADARs. Nature Reviews Molecular Cell Biology, 17, 83–96. https://doi.org/10.1038/nrm.2015.4 (Institutional access may be required)
Artificial Intelligence and Machine Learning
- Li, S., Xiao, T., Lan, Y., Wu, C., Li, Z., Liu, R., Fang, Q., & Zhang, C. (2026). Artificial intelligence revolution in transcriptomics: From single cells to spatial atlases. Advanced Science, 13(5), e18949. https://doi.org/10.1002/advs.202518949 (Open Access)
- Khosravi, A., Khosravi, A., Łangowski, K. et al. An accuracy and calibration benchmark of scGPT pipelines and matched classical models for cell type annotation. Sci Rep (2026). https://doi.org/10.1038/s41598-026-77853-3 (Open Access)
- Gaballa, Y., Ahmed, S., & Abdelaal, T. (2026). Benchmarking single-cell foundation models in a zero-shot setting. openRxiv. https://doi.org/10.64898/2026.08.03.739553 (Open Access)
Plant Science and Agriculture
- Panahi, B., & Shahi, A. (2024). Transcriptome data mining in combination with co-expression network analysis identifies the functional modules and critical regulators in Hordeum vulgare L. in response to cold stress. Biochemistry and Biophysics Reports, 37, 101620. https://doi.org/10.1016/j.bbrep.2023.101620 (Open Access)
About Author
Dr. Niamat Khan, PhD, is a molecular geneticist, genomics researcher, and university educator with over 19 years of experience in genetics and molecular biology. Currently, he serves as an Assistant Professor in the Department of Biotechnology & Genetic Engineering at Kohat University of Science & Technology (KUST), Pakistan. In addition to his academic responsibilities, his research interests encompass human genetics, genomics, molecular biology, bioinformatics, and emerging applications of artificial intelligence in genomics.
To learn more about his academic background, research interests, and professional experience, visit his Academic Profile.